Note: I am a historian of physics, not a physicist — people seem to sometimes get confused on this because of the subject matter I study and where I have worked. You can read more about my research on my blog, Restricted Data: The Nuclear Secrecy Blog.
In July 2013, I unveiled NUKEMAP2 and NUKEMAP3D. NUKEMAP2 allows for many more effects visualization options, and the display of casualties and fallout information. NUKEMAP3D allows for the visualization of mushroom cloud sizes in a 3D environment. In December 2013, I upgraded the blast model of NUKEMAP2 to account for arbitrary-height detonations. In April 2015, I performed a major algorithm upgrade to the casualty model to give it much finer-grade calculation of people over small areas and to generally increase its speed of calculation.
Various other tweaks and additions have been made over the course of the intervening years. In 2018 the underlying map engine was converted to Mapbox and Leaflet, because Google changed their pricing scheme in a way that meant my costs went up by a factor of ten, which was unaffordable.
NUKEMAP3D's development has been put on hold after Google announced its deprecation of the Google Earth Plugin API, on which NUKEMAP3D relies.
Please do not use the NUKEMAP for the purposes of planning an actual detonation. Thank you.
Note: I am an academic, and do not make any money from the NUKEMAP directly (there are no advertisements, none of the data is "monetized"). My economic ecosystem (academia) is one based fundamentally on credit and attribution, which is what allows me to get grants, funding, promotions, etc. This is why I appreciate being properly credited.
If you are in a position to license the NUKEMAP imagery (e.g., contribute money towards its upkeep and further development), please feel free to get in touch with me.
If you have any further questions about use of the NUKEMAP or its resources, please get in touch.
If you are interested in using a "live" version of the NUKEMAP on your website, get in touch with me and we can talk about the various ways to do that.
If you are a museum and are interested in the possibility of making an interactive NUKEMAP-kiosk, or even a non-interactive but dynamic NUKEMAP display, get in touch with me. I have already developed code bases that allow for such things (a kiosk version of the NUKEMAP can be seen at the Intrepid Museum's A View From the Deep: The Submarine Growler and the Cold War exhibit, for example), so development of such a thing can be done fairly easily and quickly. In general I do charge in most cases for any additional labor I need to do.
All of the coding, design, and adaptation of the old Cold War models to modern Javascript was done by Alex Wellerstein (me). The population density dataset was graciously purchased for this use by the Center for History of Physics at the American Institute of Physics, and AIP in general needs to be credited for supporting the NUKEMAP activity. See the Support section below for full credits.
The NUKEMAP is aimed at helping people visualize nuclear weapons on terms they can make sense of — helping them to get a sense of the scale of the bombs. By allowing people to use arbitrarily picked geographical locations, I hope that people will come to understand what a nuclear weapon would do to places they are familiar with, and how the different sizes of nuclear weapons change the results.
There are many different political interpretations one can legitimately take away from such results. There is not intended to be a simple political "message" of the NUKEMAP.
See the support section below for further credits and support information.
As for terrorists: If we get to the point where a terrorist group is asking, "where should I set off my nuclear weapon that I have?" then we've already gone past the point of no return. There's no way to avert a catastrophe at that point. No terrorist is going to be surprised that nuclear weapons do a lot of damage. Similarly, it isn't exactly too hard to figure out what the most attractive targets would be even without such a map (the most populous or politically important areas of a target country). So I don't really consider the NUKEMAP to be giving such people anything new. The reason terrorists don't currently have nuclear weapons (so far as we know) has nothing to do with them not being aware that nuclear weapons are impressive and devastating.
All of the effects models used by the NUKEMAP are unclassified. There is no secret information here. What the NUKEMAP does is make the models easier to visualize. I've had a hard time seeing any harm in that. A nuclear effects calculator is not a nuclear weapon. It seems like an obvious statement, but people seem prone to mixing these up.
For NUKEMAP, after the user specifies the detonation information, it calls upon a nuclear effects library written in Javascript. This library outputs distances for various effects of the bomb. These distances are then translated into coordinates that the Google Maps API can understand (either circles of fixed radii or more complicated fallout polygons), and then displayed through the Mapbox interface.
The casualty estimator uses an ambient population density database to query the number of people who are within various distances of ground zero, and applies a model of casualties to those raw numbers. See more information on this below. The casualty code runs off of PHP and MySQL.
Once it has determined this, it then looks through a database of "large global cities" for a city which is close to where it thinks you are located. The idea here is that while your random city might not be a plausible nuclear target, a nearby large city might be, and you've probably been to "the big city" nearby. (The exact determination of which "large global cities" is on the list is tricky; most large cities should be on it, unless they are within the orbit range of a much larger city.)
If it can't find a large city nearby, it just defaults to your nation's capital city (where "your nation" is guessed from your IP address).
If all of this fails (if it has no idea where you're at), it just chooses New York City. The reason for New York City is that it has traditionally been the "most frequently nuked city" in at least the American nuclear imagination, so I figure as far as selecting a default city one can argue there is a historical precedent. It is also one of the most visited cities in the world.
I might also note that I live right next to NYC (Hoboken, NJ), and am in Manhattan at least once a week, so I don't think I can be accused of trivializing its destruction, which would affect me greatly and personally.
None of this approach is perfect, but it seemed like a good tradeoff in terms of difficulty and privacy issues (having NUKEMAP request your exist location felt creepy, and would be much slower in any event).
This feature was updated in June 2019.
Suggestions for new additions are always appreciated, even if they can't usually be implemented! But feel free to send them along. I'll do what I can to reply in a timely fashion.
- NUKEMAP3D doesn't work at all. NUKEMAP3D has been discontinued because Google stopped supporting the Google Earth Plug-in. Sorry! You can use the "Export to KMZ" option in the "Advanced Options" menu to see what it looks like offline, using the Google Earth stand-alone application.
- Sometimes the map doesn't load on some systems. This appears to be an issue with Mapbox. I am working on it.
- NUKEMAP's casualty equations don't take into account fallout, fire, etc. Modeling these things are tricky. Maybe some of these things will be taken into account in the future. Maybe not. We'll see. It depends on funding support, the availability of usable models, etc.
- NUKEMAP doesn't take into account Electromagnetic Pulse (EMP) effects. The range of EMP effects as they relate to both height of burst and detonation yield are very hard to model (there is very little by means of unclassified models for them; there are a lot of simple diagrams out there, none of which are very dynamic). Even harder to model is what those range of effects would mean for people on the ground (it is not as simple as saying "anything electronic in this range of effects would be disabled"). For the moment I am not going to try to model EMP effects both because it is difficult (and my time and resources are limited), and also because I'm afraid of either under- or over-stating the impact of a very controversial and contentious effect, one that various groups have politicized in recent decades.
- The humanitarian impact option doesn't show up. This is currently (hopefully temporarily) disabled, because I moved from the Google ecosystem and haven't worked out a replacement yet.
- When exporting fallout plumes to Google Earth's KMZ files, the wind directions are wrong. I know. I'll fix this when I get the chance.
- NUKEMAP is not very mobile friendly! Boy, do I know it. I'm working on a mobile-friendly stylesheet. It's tricky because the NUKEMAP has a lot of information and information density, and was designed around relatively wide screens. But there should be some better accounting of this in the near term.
- The version of NUKEMAP being used.
- The detonation settings used (kilotons, fallout, casualties, height of burst, etc.). used.
- The latitude and longitude of the "target," along with a geo-located country name of the target (because geo-location is easier to do as you detonate as opposed to doing it later).
- If available, the approximate latitude, longitude, and geo-located country of the user. This information is based on your IP address, and often just gives the location of your Internet Service Provider, which is often a few towns over from you anyway. I use a publicly available IP mapping database for this. Note that I never store your IP address on any servers of mine.
- How many active detonations there are, and whether the detonation was set off by "you" or whether you clicked a link to get to it.
Why do I record this information? It's because I'm interested in broad usage patterns. You can see a write-up I did of past usage patterns here to get an idea of what I'm doing with them. I want to know whether people nuke themselves or other countries, and what types of bombs they use, and what kinds of scenarios they imagine. As far as I know, no government is going to knock on your door late at night just because you used the NUKEMAP; many tens of millions of people globally have used it, many thousands are using it every day.
Separately, I use Google Analytics to keep track of web and browser statistics in general. This information is not correlated with the actual "detonations."
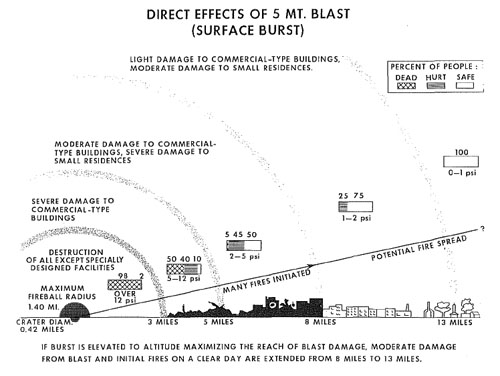
A few of the equations are taken from my own curve fits of data in Samuel Glasstone and Philip J. Dolan, The Effects of Nuclear Weapons, 1977 edition. In particular, the original curves for the calories per square centimeter needed for various burns were significantly modified in the 1977 edition, so my equations reflect that. The blast effects were also taken from the graphs in the 1977 edition (see below).
There are several airburst options. One is "Maximize airburst radii for all effects," which will show what the maximize size of each effect ring would be if the idealized airburst height for that effect ring was chosen. This can be a bit misleading, because it is really showing you a spread of different altitudes (each of the blast effects will indicate what the optimized height of burst is).
Another is "Optimize for overpressure." This means that for a given radius of maximum overpressure (e.g., 5 pounds per square inch), the code will figure out the altitude of detonation of the weapon that would maximize it. The reason that such optimized altitudes exist is because at certain detonation heights, the blast wave will reflect off of the ground and interact constructively with itself. This is graphed in a so-called "knee curve" that shows how at certain heights there is a big "bulge" in the radius of a given overpressure:
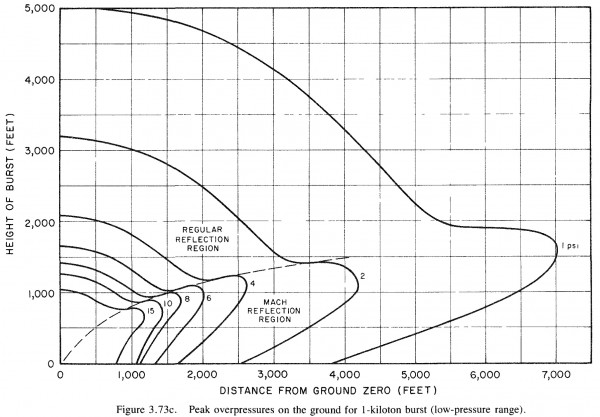
NUKEMAP's code uses data from Glasstone and Dolan's charts (like the one above) which has been translated into raw numbers. Unknown points are interpolated. More details on this are available in this blog post. In the case of the optimized choice, NUKEMAP will figure out the optimal burst altitude and then render the effects as if you have selected an arbitrary burst height (see below).
The "burst height" option allows you to set an arbitrary height of burst. It will scale all effects except the fireball for what the effects on the ground would be. (Generally speaking, the fireball radius matters only for ground effects if the bomb is detonated at surface or near-surface heights.) In the case of the blast effects, it takes into account whether there is Mach reflection or not (using charts like those shown above). For thermal and radiation effects, it calculates an idealized sphere of maximum effect and then uses slant range to find where it would intersect with the ground.
None of these models do not take into account terrain, building shielding, atmospheric reflection (e.g. off of inversion layers), or atmospheric opacity (e.g. there are different thermal propagation rates depending on humidity). This is because modeling these effects is much more difficult, and requires accurate information about the terrain, buildings, and atmosphere, which I do not have access to (as of yet), and even if I did, might require computational resources exceeding those of a web browser. Including these sorts of effects in a future version of the NUKEMAP is a potential goal, but there are technical limitations involved. One should consider the NUKEMAP's visualized effects to be "back-of-the-envelope," "order of magnitude" estimations that might be either increased or decreased under different local environmental situations or different assumptions about the targets.
It is very difficult to accurately model radioactive fallout. There are many relevant variables: the height of the blast detonation, the ratio of fission to fusion reactions in the bomb (most thermonuclear weapons derived at least 50% of their yield from fission reactions), the type of terrain the explosion is detonated on or over (e.g. desert, coral reefs, inhabited cities), and, importantly. the weather conditions, including wind shear at the many different altitudes at which the cloud exists. (Mushroom clouds go up to the 10,000-100,000s of feet and are exposed to different wind conditions along that distance.)
There are two basic approaches to modeling fallout. One is to try and develop a model based on weather conditions. These are complex and computationally intensive, but yield results that match up very well to past testing results. The other are what are known as "scaling models," which present graphs that attempt to give a general idea of the approximate distances of various levels of radioactive exposure, but make no attempt to model realistically specific wind conditions.
The NUKEMAP fallout model is a scaling model. This is not because scaling models are the best, necessarily, but there are things in their favor. For one, they are computationally very easy: one does not need to know detailed meteorological data about the location of the detonation, and thus can be generalized to many times and places very easily. Their falseness is also quite apparent: people are not as likely to confuse their contours as being entirely realistic estimates of what would actually happen, but will understand them to be rough indications. Lastly, there are good pre-existing scaling models available for use, whereas detailed weather models are generally harder to get ahold of, and the prospects of them working quickly even in modern web browsers is not as clear. (If someone has a more complicated model that they'd like to share with me, I'd love to hear from you.)
The scaling model used in the NUKEMAP is based on the work of Carl F. Miller, who published extensively on fallout in the 1960s based on information derived from American atmospheric nuclear testing (which ended in 1963 after the signing of the Limited Test Ban Treaty). His "Simplified Fallout Scaling System" (SFSS) was first outlined in the following report: Carl F. Miller, "Fallout and Radiological Countermeasures, Volume 1," Stanford Research Institute Project No. IM-4021 (January 1963). The copy available on the web has been scanned in from a hard-to-read microfilm copy. A clearer version of the relevant equations is available here, which I photocopied from an original copy of the report on file at the National Library of Medicine. As you can see, even the original is a bit hard to read. Another version was reprinted in Werner Grune, et al., "Evaluation of Fallout Contamination of Water Supplies," Final Technical Report, Contract No. OCD-PS-64-62, OCD Subtask 3131B (1 October 1963-15 May 1965), Office of Civil Defense, Department of Defense, Washington, D.C., Part IV, "Summary and Analysis of the Miller Fallout Model." This one is much easier to read, and gives some corrections to Miller's original model, and explains it slightly differently, which was helpful as well. My implementation of the SFSS in Javascript and Google Maps was developed by tacking back between these multiple sources.
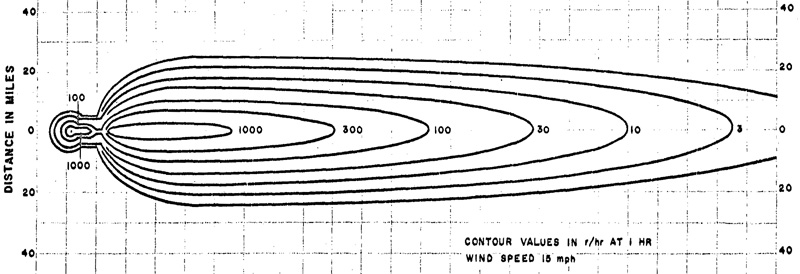
The Miller fallout model works by assuming that the fallout plume is a result of both the cloud and the stem. Basically the elongated shape of it is sort of like a mushroom cloud put on its slide and smeared out. Here is a Miller's drawing of the final shape of a 1 Mt yield surface burst at a wind speed of 15 mph and with 100% fission yield:
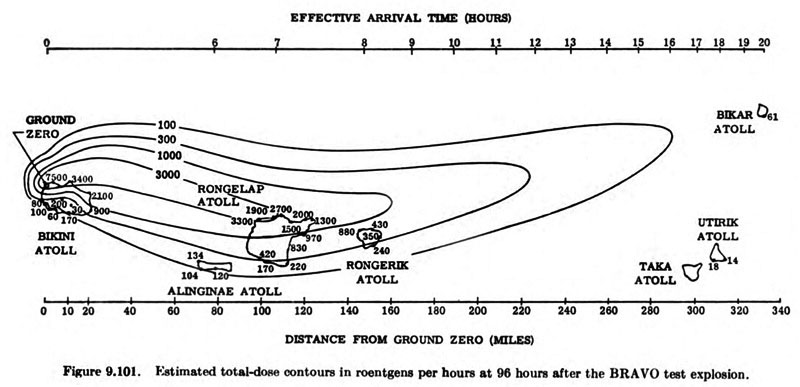
At first glance it doesn't look much like the fallout contours one might be used to, like this one of the Castle BRAVO detonation from 1954:
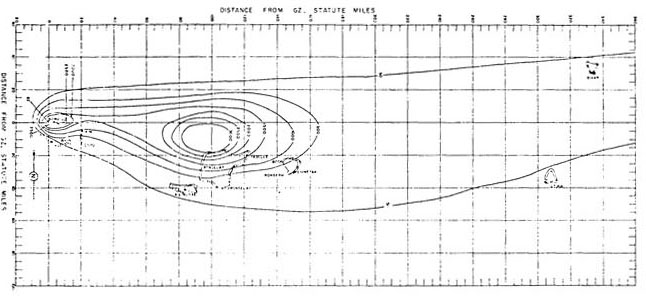
But part of that is because the ones people are used to have often been "cleaned up" and modified a bit to look better. This is another version of the BRAVO contours, created by the RAND Corp. from the same data, and you can see the resemblance to the Miller model in terms of the separation of stem and cloud fallout, leading to a large downwind "hot spot":
Separately, it is worth noting that real fallout evolves over time. The scaling models are known as H+1 models, which is to say that the fallout has been "normalized" to what it would look like after 1 hour, assuming that its maximum time to its final size was 1 hour. This is quite standard in the fallout literature, despite the fact that for large detonations, the arrival time is much longer than 1 hour. Here, for example, is the evolution of the BRAVO fallout plume over 18 hours:
So of what value is the H+1 hour model? It lines up not too poorly with the final total-dose contours for the fallout plume, and as such could be taken as an idealized understanding of what your average rad dose per hour would be downwind of the blast. It is meant, by Miller and by me, to give an indication of the rough size of the contaminated area after a nuclear explosion, which has both pedagogical and planning value, even if it is a little confusing in terms of the movement of the actual cloud.
If you want to translate the H+1 dose to a "dose on the ground," use the "Probe location" feature. It will let you select a point on the ground downwind of the cloud, and will give far more information, based on wind speed, time exposed, and potential shelter, on what the effects on the ground would be.
Note that this model is exclusively for modeling a surface burst, not an airburst. Airbursts do contribute to long-term fallout (e.g. the overall radioactivity in the atmosphere, or the amount of cesium-127 that eventually makes it into human diets at very, very long distances), but, by and large, contribute only negligibly to short-term local fallout. This appears to be the case even with very large yield airbursts that contain significant fission products. The line between an "airburst" and a "surface burst" in such a consideration is whether the fireball touches the ground, as this pulls up significant numbers of heavy particles (e.g. dirt, coral, buildings, people) into the rising fireball, and these heavy particles affect the "falling out" considerably. When the fireball does not touch the ground, the fireball appears to rise high enough and fast enough that the bulk of its fission products do not fallout until much later, when they have lost much of their radioactivity. (Radiation energy is inversely related to time— this is the import of "half-life" measurements. The more radioactively active a given isotope is, the quicker it reduces in quantity. This does not mean that all radioactive hazard dissipates quickly, but the nature of the hazard between short-lived, highly-energetic particles is different than long-lived, moderately-energetic particles. The former are an immediate, acute radiation hazard— e.g., they can give you radiation sickness and hurt you in a few hours or weeks —and the latter are a long-term, chronic radiation hazard — e.g., they can give you cancer and hurt you in several years or decades.)
In short, a spatial query is run on database whenever casualties are requested. The database spits back information about how many people live within several radii of ground zero. This information is then used to generate a list of casualties and injuries, according to data contained in a 1973 report by the Defense Civil Preparedness Agency titled DCPA Attack Environment Manual, later reprinted in the 1979 Office of Technology Assessment report, The Effects of Nuclear War:
As you can see, it primarily relies on blast effects (pounds per square inch) as a proxy for calculating injuries and fatalities.
There are limitations to this model. For some yields, especially those which are very low or very high, blast effects are less important than thermal or radiation effects. The model itself also does not take into effect the fact that highly dense urban areas have a "shielding" effect from blast effects — those buildings nearest the ground zero bear most of the brunt of the blast. It's also not entirely clear what the OTA based these estimates on.
So the numbers might be too high. They also might be too low. Without taking into account many more variables than the model can deal with, like terrain type, building type, expected reaction of the bombed populace, and radioactive fallout, it's hard to do anything more than gesture at the numbers that would be affected by a nuclear explosion. I'm not trying to say "it's too complicated, so any model is as good as any other." But in choosing a model I went with one that could be relatively straightforwardly be implemented given the data I have available, and was backed by at least one serious source. So I thoroughly encourage you to take these numbers with a grain of salt — they give some indication of how many people live in reasonably close proximity to the selected ground zero.
I have seen some other official estimates of fatalities and injuries that put the numbers (especially of the injured) much higher than the estimates that are given by the casualty model here, and I have seen some other official estimates of blast effects that would put it lower depending on the building types. It's not my intention to over- or under-exaggerate the effects.
The point of the "humanitarian impact" model is to emphasize some of the collateral impacts of a nuclear explosion, and to indicate the ways in which support services (e.g. hospitals and fire stations) would be themselves impacted by a nuclear attack.
NOTE: The humanitarian impact model is temporarily disabled because of my switch from the Google platform. I intend to bring it back in the near future.
The mushroom cloud model dynamics come primarily from Carl F. Miller, "Fallout and Radiological Countermeasures, Volume 1," Stanford Research Institute Project No. IM-4021, January 1963. Miller was, in his day, considered one of the premier experts on modeling mushroom cloud behavior. Some of the information also comes from curve fitting various figures (in particular the rate of cloud rise) in Samuel Glasstone and Philip J. Dolan, The Effects of Nuclear Weapons, 1977 edn.
For the 3D-modeled (KMZ) cloud, given the limitations of Google Earth's API (you can move, rotate, and scale models but not otherwise manipulate them), I had to do a little bit of fudging to make things look right aesthetically. But many of the parameters, such as the rate of rise, the changing size of the cloud head, and the final size of the cloud, are taken directly from models derived from nuclear test data.
The Center for the History of Physics at the American Institute of Physics generously supported my initial creation of the NUKEMAP as part of my work as Associate Historian, from 2011-2014. They also paid for my license to the LandScan population density database.
The School of Humanities, Arts, and, Social Sciences at the Stevens Institute of Technology generously supported my (ever-increasing) server and API fees associated with hosting the NUKEMAP until 2020 (COVID eliminated some of the discretionary funds that were used for this). Some of these fees are supported by the research fund associated with my being the David & G.G. Farber Faculty Fellow in Science and Technology Studies.
From 2020 through 2023, Global Zero generously paid for NUKEMAP's server and map-tiling fees, including during the unprecedentedly-high traffic spikes after the Russian invasion of Ukraine. I am extremely grateful to them.
In late 2023, the Ploughshares Fund funded a grant to pay for NUKEMAP's upkeep and several major code revision initiatives that are presently in progress.
Aspects of expanding the NUKEMAP's codebase have been supported by N Square and the Future of Life Institute. Bluecadet the Outrider Foundation collaborated with me for creating their NUKEMAP-derived Bomb Blast website. Outrider also assisted me with bridge funding in the summer of 2023 to keep the NUKEMAP online.
Over the years, several Stevens undergraduates have helped in working on aspects of expanding the NUKEMAP effects model, notably Jeffrey A. Meli, Benjamin Blease, Lucas Gembarzewski, Troy Chartier-Vignapiano, Elena J. Gies, and Mora Pochettino.